| Compile and link the code with the -g flag to cc(1) or gcc(1). |
The -g flag directs the compilers to include extra symbol table information in the object file that is needed by debuggers.
| Give the command ups a.out (or whatever you called the object file). |
After a short pause a window will be created; the details obviously depend on your window manager.
This is the simplest way of invoking ups. For a complete description of the command line flags and arguments see UPS COMMAND LINE ARGUMENTS.
|
In the window you should see a display divided into various rectangular
boxes and menus, with two large regions in the upper and lower halves
of the window.
Note: the layout of the window is explained in detail in a later section.
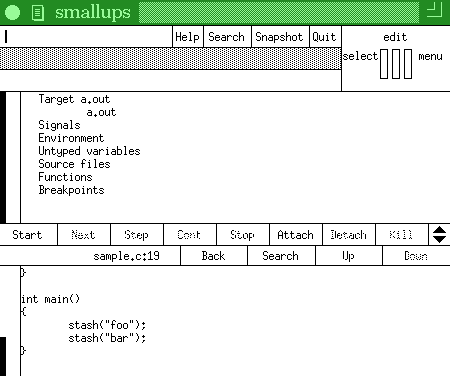
The top region is the display area - it contains captions looking roughly like:
|
|
| In the lower region you should see the start of main() displayed. |
There are two important buttons in the top menu bar : Quit and Help
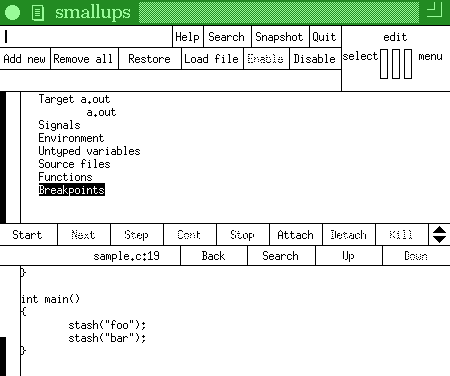
| Move the mouse cursor over the Breakpoints caption in the upper region, and press and release the left mouse button. |
|
You should see two things happen: the caption is inverted to show that
it is selected, and a menu appears near the top of the window with the
captions
Add new, Remove all, Restore, and Load file.
All the objects in the display area (except Functions) can be selected like this and have their own menus. Selecting an object (or many objects) and clicking on one of the commands in its associated menu is the primary way of issuing commands to ups. |
|
| Click (press and release) the left mouse button over the Add new menu caption. |
You should see a line below the Breakpoints caption looking like:
Function:| line: 0 The vertical line represents the editing cursor, which indicates where typed characters will appear. (this is actually displayed as a solid black rectangle on the screen). |

|
| Type main |
You can use the delete key as you would expect to fix typos. There are various other useful control characters - see the EDITABLE FIELDS section for details.
| Press ESC (the escape key). |
| This confirms the edit. |
|
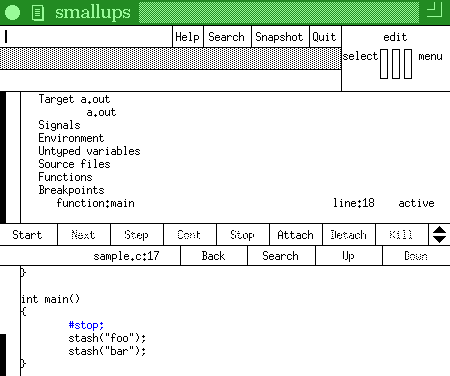
You should see the text
appear at the start of main() in the source region.#stop; |
Ups represents breakpoints as this fragment of pseudo `C'. You can edit breakpoints to do things other than just stop (e.g. call a target function or only stop if a certain condition is true). This is covered later in this section, and described fully in the section ADDING INTERPRETED CODE.
You can also add breakpoints by pointing at the appropriate line in the source region - this is described later in this section.
| Click the left button over the caption Start at the left hand side of the menu just below the display area. |
This menu is the target control menu. Here is a brief description of what the other commands in this menu do (these are explained in more detail in the CONTROLLING TARGET EXECUTION section).
- Start starts the target running.
- Step and Next step execution over single lines of code (Step steps into function calls, Next doesn´t).
- Cont makes the target process run until it hits a breakpoint or exits.
- Stop stops a running target process, queues a request to terminate a symbol search, or breaks out of a Step that takes a long time, and
- Attach prompts for a PID of a target process to attach to (for SunOS), and
- Detach detaches from an attached process.
- Kill kills off the target process, ready for another run using Start.
If you look at the display area you will see that a new
line has appeared under the Functions object.
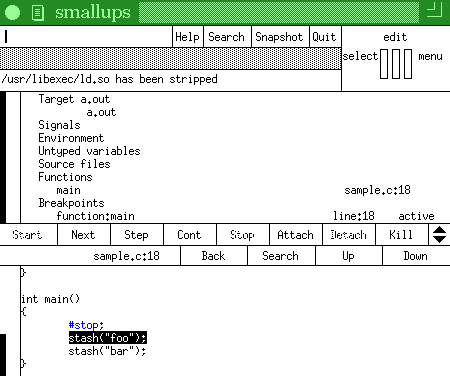
This should look like:
main sample.c:18 This shows that you are stopped at line 18 of sample.c in function main(). |
|
| You should see the first line of code in main() is highlighted. This means that execution has stopped just before this line. |
At this point you are in the usual state for ups: you have the target stopped, with the line that is about to be executed highlighted in the source window and your current position in the source file shown under the Functions object in the display area.
| Click on Step in the target control menu. |
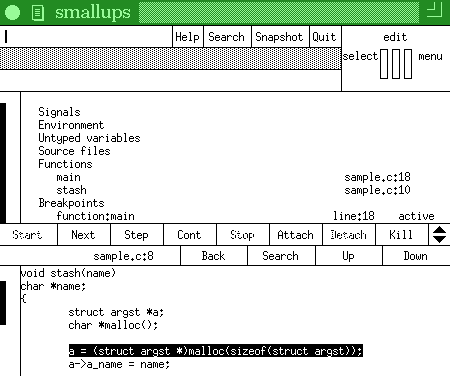
The source display switches to function
stash, which you have just stepped into.
You will also see an extra line under Functions - the display should look like:
main    sample.c:18
stash   sample.c:10
As you can see this is a stack trace, showing you which function called which starting from main and working inwards towards the function you are currently stopped in. |
|
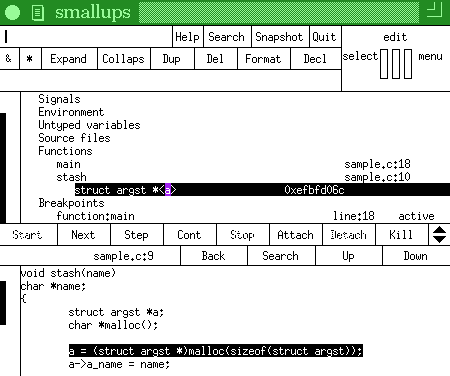
| In the source region move the mouse over the a at the start of the highlighted line and click the left mouse button. |
You should see a line added to the stack trace, making it look like:
main    sample.c:18
stash   sample.c:10
  struct argst *<a>  0x4
This is one of the main strengths of ups: to see the type and value of any variable that is visible in the source window you simply click on its name. This is showing that a is a variable of type struct argst * with the value 4. This is an uninitialized variable, so the value you see will probably be different from this. |
|
You will also notice that the menu near the top of the display area has changed. Every object in the display area has an associated menu, which is displayed when that object is selected. Ignore the menu for now.
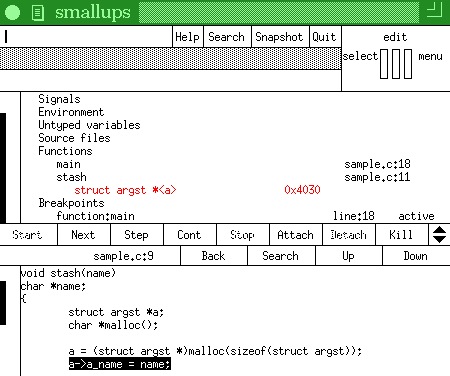
| Click on Next in the target control menu. |
|
The value displayed for the variable a
changes to whatever is returned by malloc().
This shows another key feature of ups - displayed variables remain in the display area as you step through the program code so you can watch the values change. |
|
| Now click the left mouse button over the displayed line for the variable a. |
The line will be inverted to show that it is selected and a menu will appear as before near the top of the display area.
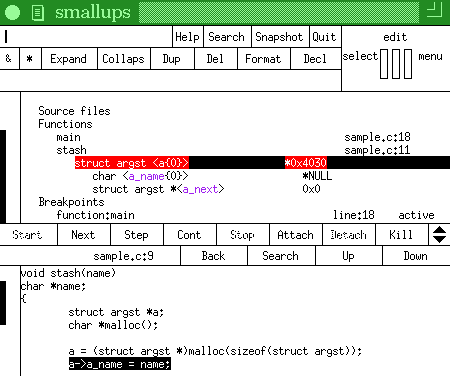
| Click on Expand in the menu that was produced by the last step. |
You will see an entry added for each member of the structure, giving a
display under the Functions object that looks something like:
main    sample.c:18
stash   sample.c:11
  struct argst <a{0}>     0x60c8
    char <a_name{0}>       *NULL
    struct argst *<a_next> 0x0
The member types and values are shown in the same way as the structure pointer a itself. As before the values are uninitialized, so the values you see will depend on the exact behaviour of your malloc() implementation. |
|
| Click on Next in the target menu. |
|
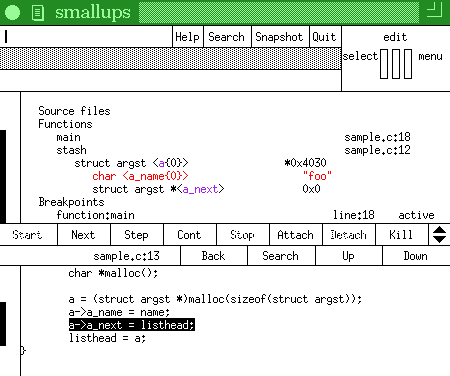
The highlighting in the source window will move on to the next line,
and the value displayed for the a_name field will change.
This sort of interaction is typical use of ups - you expand structures to see members of interest, and then step through the source code watching how they change. |
|
| Move the mouse over the highlighted source line, press and hold down the right hand mouse button then release it. |
|
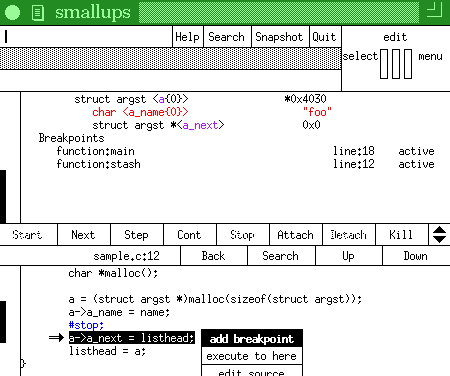
When you pressed the mouse button you will have seen a popup menu with
the captions
Add breakpoint,
Execute to here,
and
Edit source.
You will also have seen an arrow to the left of the menu pointing at the
source line you pressed the mouse over.
When you release the mouse button a breakpoint is added just before the source line. You will see the text #stop; appear. This is the simplest and most common way of adding breakpoints in ups. |
|
The normal sequence of actions is:
- Type the name of the function you are interested in (or enough of
it to uniquely identify it) and hit ESC (the escape key).
The source of the function is displayed in the source window.
- Scroll the source to make visible the line where you want to
add a breakpoint.
- Add a breakpoint by clicking the right mouse button over the source line.
| Click on Cont in the target control menu. |
|
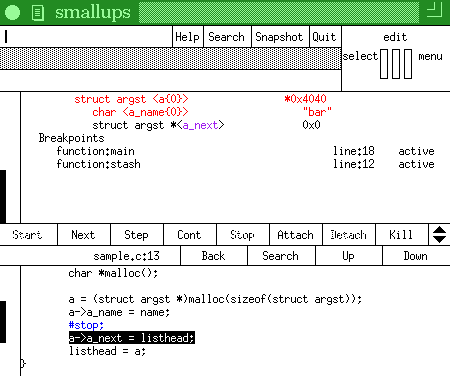
The target continues until it hits a breakpoint.
In this case the target stops in the second call of
stash() from main.
You will notice that in the display area the displayed value of a_name has changed. |
|
| Click on Cont again. |
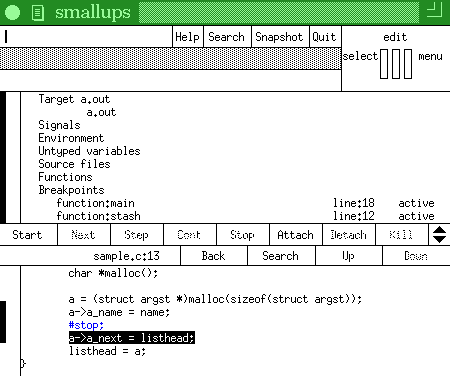
| The target continues to completion and exits. The stack trace and variables disappear from the display area, and all the target control menu captions except Start are greyed out to indicate that they are unavailable while the target is stopped. |
|
We are almost at the end of this example...
If you want to, Quit now and try using ups on one of your own programs. Then come back and read how to add interpreted C code, which allows you to set conditional breakpoints, call routines etc.
Ups has help information available through the Help button in the top menu bar.
|
Adding interpreted code
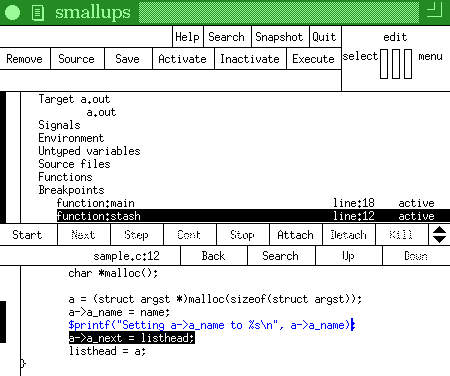
These last steps are to show how you can add printf calls (in fact any interpreted `C'). The actions we are about to cover are :
|
| Move the mouse over the #stop; text that indicates the breakpoint in the stash() function and click the middle mouse button. |
You should see an editing cursor (a black line) appear.
If it is not at the end of the #stop;
text then click the middle mouse button further to the right.
|
|
If you haven´t made any errors ups will silently accept the line and the editing cursor will disappear.
If you have made a syntax error ups will beep, give you an error message and put the editing cursor at the point of the error. You can then correct the error.
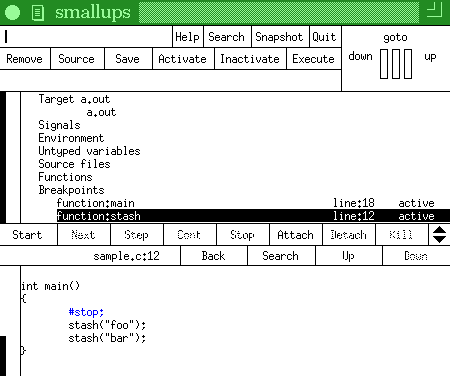
| Press and hold down the left mouse button in the scroll bar to the left of the source window, and with the mouse button pressed move the mouse button a few pixels towards the top of the window. |
You should see the source text scrolling slowly upwards. The more you move the mouse from the place you first pressed it, the faster the source scrolls.
| When you see the source of Main appear in the source window release the mouse button. |
|
The scrolling will stop.
You can also scroll the display by clicking in the scrollbar : the left hand mouse button scrolls down and the the right hand mouse button scrolls up. Clicking the middle mouse button scrolls the display to the line indicated in the target control menu, in this case line 12 of sample.c. |
|
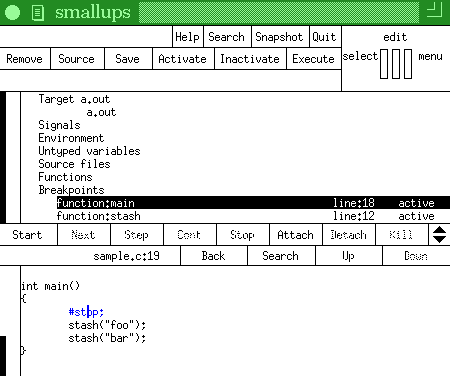
| Click the middle mouse button on the #stop at the start of main. |
|
This displays the editing cursor as before, but if you look in the
display are you will notice that it also selects the corresponding
breakpoint object.
You will see the breakpoint entry highlighted, as well as a menu with the captions Remove, Source, Save to file, Execute, Activate, and Inactivate near the top of the window. |
|
| Click on Remove in the menu |
You will see the breakpoint entry in the display area disappear, along with the #stop; line in the source window.
| Click on Start in the target control menu. |
|
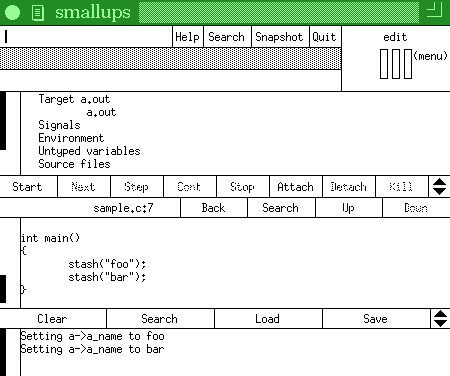
You should see a third subregion appear in the display.
This looks similar to the source window, with a controlling menu
above it and a scroll bar on the left hand side.
This is the output region. It is where output from the built in function $printf appears. This region appears the first time $printf is called by interpreted code. You will see that the text Setting a->a_name to foo Setting a->a_name to barhas appeared. This was produced by the interpreted code that you added. |
|
Note that the target ran to completion without stopping. A breakpoint only stops the target if the pseudo `C' statement #stop is executed. This lets you add conditional breakpoints simply by putting an if statement around them.
One final point: you can call target functions (like stash() in this example) from interpreted breakpoint code. This is often used to call printf in cases where you do want the debugging output interspersed with the target program´s output.
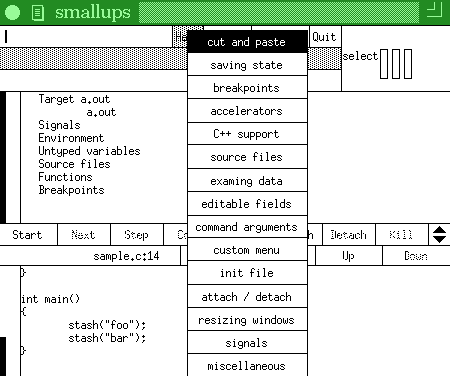
| To look at the help information... |
| To look at the help information, move the mouse over Help in the top menu bar, press and hold down the left hand mouse button, and a pop-up menu will appear. Highlight the topic you want to view, and release the button. |
|
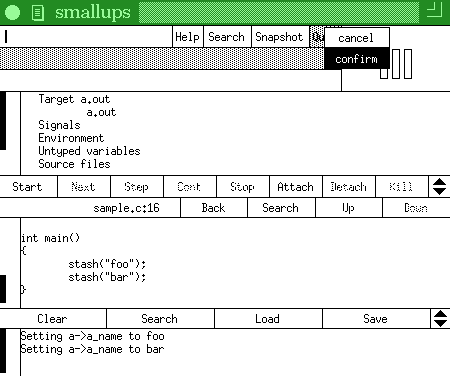
| To quit from ups... |
| To quit from ups, move the mouse over Quit in the top menu bar, press and hold down the left hand mouse button, and a pop-up menu will appear. Highlight Confirm and release the button. |
|